3 Top Strategies Using Ichimoku Charts to Elevate Your Trading Game
1/14/20252 min read
Understanding Ichimoku Charts
Trading can often feel like sailing through stormy seas—complicated, unpredictable, and challenging at times. But with powerful tools like Ichimoku charts, you can gain a clearer view of the market's conditions and make more informed decisions. The Ichimoku chart is a comprehensive system that provides valuable insights into support and resistance levels, trend direction, and potential entry and exit points. In this post, we're diving into three top strategies that can help you harness the power of these charts and take your trading to the next level.
1. Identifying Trend Direction
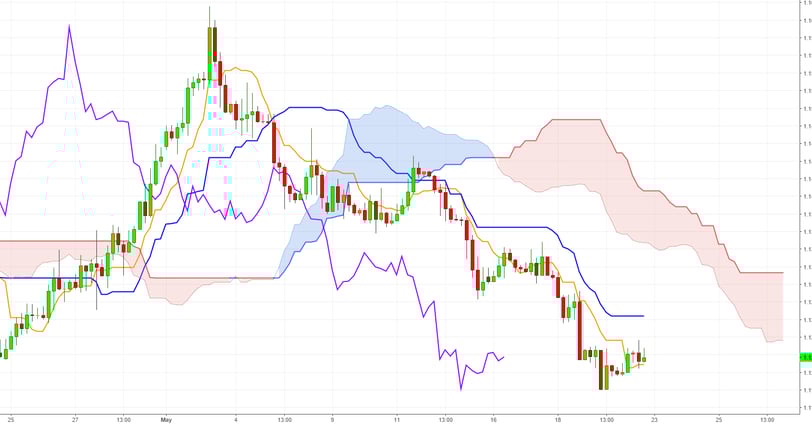
The first strategy revolves around identifying the overall trend direction. Ichimoku charts consist of several lines, including Tenkan-sen (fast line) and Kijun-sen (slow line), which can help you gauge whether the market is in an uptrend or downtrend. A simple way to interpret this is to look at the relationship between the Tenkan-sen and Kijun-sen. If the Tenkan-sen is above the Kijun-sen, it indicates a bullish trend; if it's below, you're likely facing a bearish trend. Knowing the trend direction can help you align your trades accordingly, stacking the odds in your favor.
2. Finding Key Support and Resistance Levels
Next up, let's talk about support and resistance—which are vital concepts in trading. The Ichimoku chart provides two key components for identifying these levels: the Senkou Span A and Senkou Span B. These two lines form a 'cloud' that helps determine the price's support and resistance zones. When the price is above the cloud, the market is generally considered bullish, while a price below the cloud typically suggests a bearish sentiment. Knowing these levels can help you strategically enter and exit trades, as they act as psychological barriers for traders.
3. Taking Advantage of Crossovers
The final strategy focuses on crossovers between the Ichimoku lines. Crossovers can signal potential trading opportunities. For instance, when the Tenkan-sen crosses above the Kijun-sen, it’s often seen as a buy signal. Conversely, when the Tenkan-sen drops below the Kijun-sen, it may indicate a sell signal. These crossovers, combined with the cloud's confirmation, can help solidify your trading decisions, turning the Ichimoku chart into a powerful ally on your trading journey.
In conclusion, these three strategies using Ichimoku charts can serve as excellent tools to level up your trading game. By identifying trend directions, spotting key support and resistance levels, and taking advantage of crossovers, you can make better-informed trading decisions that could lead to success. Remember, practice makes perfect, so spend some time familiarizing yourself with Ichimoku charts to become a more confident and decisive trader!